Reducing Child Poverty Can Promote Children’s Development and Productivity in Adulthood
- Greg J. Duncan, Ph.D., University of California, Irvine
- Hilary Hoynes, Ph.D., University of California, Berkeley
More than nine million U.S. children lived in families with incomes below the poverty line in 2019.1 Relative to children in higher-income families, children living in poverty have worse health, lower language and cognitive skills in early childhood, and lower achievement through school years. As they reach adulthood, children living in poverty complete less schooling, secure lower-skilled jobs, and exhibit more criminal behavior.2-6 The most rigorous evidence suggests that child poverty is one cause of these differences, particularly if it persists for a number of years or occurs early in childhood.6 The costs of heightened health care, lost economic productivity, and crime driven by child poverty have been estimated to exceed $800 billion annually.7,8 Combining existing federal income support policies shown to reduce child poverty with an expansion of the Child Tax Credit from the American Rescue Plan Act of 2021 has the potential to cut child poverty in half. This would move 4.5 million children out of poverty and likely improve their developmental outcomes.9,10
Child Poverty Before and During the COVID-19 Pandemic
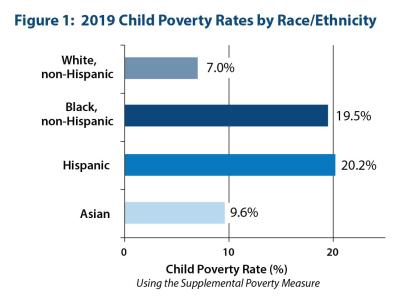
Using poverty thresholds of about $27,000 for a family with two parents and two children, about one-eighth of all U.S. children – more than nine million in all – lived in poverty in 2019. Poverty rates were more than twice as high among Black and Hispanic children (at about 20%) than among White (7%) and Asian (10%) children (Figure 111). During the pandemic, government benefits from COVID relief legislation – particularly from the CARES Act and the expanded Child Tax Credit – kept child poverty rates lower than what they would have been.12
Income Support Policies Alleviate Poverty and Thereby Improve Children’s Health, Educational Attainment, and Adult Earnings, and Reduce Crime
Although there is some variability in the evidence,13 a recent review from the National Academy of Sciences concluded that “the weight of the causal evidence indicates that income poverty itself causes negative child outcomes, especially when it begins in early childhood and/or persists throughout a large share of childhood.”14
A growing body of research shows that in most cases, cash or “near-cash” payments such as tax credits to families living in poverty improve children’s development and boost economic productivity in adulthood.6 For example:
- Studies of the food stamp program – now known as the Supplemental Nutrition Assistance Program (SNAP) – rollout in the 1960s and 1970s reveal that pregnant women who received benefits were less likely to have low birth weight babies.15 Children up to age five whose families received benefits had improved educational attainment, earnings, income, and cardiovascular health in adulthood.16,17
- Increases in the federal Earned Income Tax Credit (EITC) benefit for low-wage workers with children and the formation of state EITC programs drove increases in birth weight,18,19 school achievement,20,21 high school graduation rates, and college attendance and completion.22,23
- Research tracking youth development before and after casino revenues were distributed to some but not other families in rural North Carolina communities found income payments were associated with reduced youth psychiatric disorders, drug abuse, and crime participation as well as increased high school graduation rates.24,25
Child Tax Credit Expansions Will Further Reduce Child Poverty and Improve Child Outcomes
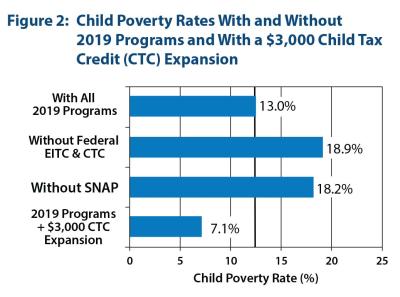
Federal programs that contribute to the largest reductions in child poverty are SNAP and two tax credits – the EITC and the Child Tax Credit (Figure 2). The pre-pandemic child poverty rate of 13.0% would have risen to 18%-19% in the absence of the 2019 versions of either the EITC or Child Tax Credit programs.26
The Child Tax Credit
- The pre-pandemic Child Tax Credit provided a $2,000-per-child annual tax credit for families with income as high as $400,000, but either no credits or smaller credits to families with children living in poverty.
- The Child Tax Credit provisions of the 2021 American Rescue Plan extend full benefits to all families living in poverty, with benefit levels set at $3,600 for each child under age 6 and $3,000 for each child age 6 and older who are born in the United States or are naturalized citizens. Benefits are paid either monthly or in a lump sum.28
- Estimates in Figure 2 assume expanded benefit levels for all children are set at $3,000.
The National Academies of Sciences found that one of the most effective policies to further reduce child poverty was to replace the pre-pandemic Child Tax Credit
with a $3,000 per-child, per-year child allowance, paid monthly, which was estimated to reduce child poverty by nearly 40%.27 This structure is mirrored in the one-year expanded Child Tax Credit included in the American Rescue Plan Act of 2021, which also includes higher payments for children under age 6.28 This expanded Child Tax Credit has been estimated to reduce child poverty by more than 50%.9,10 Taken together, evidence suggests that child poverty reduction from the expanded Child Tax Credit and other income-support policies are investments that will improve children’s development and adult productivity and enhance national prosperity.
Endnotes / References
[1] Fox, L., Glassman, B., & Pacas, J. (2020). The Supplemental Poverty Measure using the American Community Survey. Working paper 2020-09. Washington, DC: US Census Bureau, Social, Economic, and Housing Statistics Division. These data are based on the Supplemental Poverty Measure (SPM), which, in contrast to the official poverty measure, includes most non-cash sources of income and makes numerous adjustments to definition of poverty thresholds. SPM poverty thresholds in 2019 for a family with two parents and two children ranged between about $25,000 and $30,000, depending on home ownership and mortgage status.
[2] Noble, K. G., Norman, M. F., & Farah, M. J. (2005). Neurocognitive correlates of socioeconomic status in kindergarten children. Developmental Science, 8(1), 74-87.
[3] Noble, K. G., McCandliss, B. D., & Farah, M. J. (2007). Socioeconomic gradients predict individual differences in neurocognitive abilities. Developmental Science, 10(4), 464-480.
[4] Noble, K. G., Engelhardt, L. E., Brito, N. H., Mack, L. J., Nail, E. J., Angal, J., ... & PASS Network. (2015). Socioeconomic disparities in neurocognitive development in the first two years of life. Developmental Psychobiology, 57(5), 535-551.
[5] Farah, M. J., Shera, D. M., Savage, J. H., Betancourt, L., Giannetta, J. M., Brodsky, N. L., ... & Hurt, H. (2006). Childhood poverty: Specific associations with neurocognitive development. Brain Research, 1110(1), 166-174.
[6] National Academies of Sciences, Engineering, and Medicine. (2019). A roadmap to reducing child poverty. Washington, DC: National Academies Press.
[7] Holzer, H. J., Whitmore Schanzenbach, D., Duncan, G. J., & Ludwig, J. (2008). The economic costs of childhood poverty in the United States. Journal of Children and Poverty, 14(1), 41-61.
[8] McLaughlin, M., & Rank, M. R. (2018). Estimating the economic cost of childhood poverty in the United States. Social Work Research, 42(2), 73-83.
[9] Parolin, Z., Collyer, S., Curran, M., & Wimer, C. (2021). The potential poverty reduction effect of the American Rescue Plan (No. 20411). Center on Poverty and Social Policy, Columbia University.
[10] Wheaton, L., Minton, S., Giannarelli, L., & Dwyer, K. (2021). 2021 poverty projections: Assessing four American Rescue Plan policies. Washington, DC: Urban Institute.
[11] U.S. Census Bureau (2020). Current population survey annual social and economic supplement, 2020. Retrieved from: https://www.census.gov/programs-surveys/cps.html
[12] Parolin, Z., Collyer, S., Curran, M., & Wimer, C. (2021). Monthly poverty rates among children after the expansion of the Child Tax Credit. Poverty and Social Policy Brief, 5(4), New York, NY: Center on Poverty & Social Policy.
[13] See, for example, Jacob, B. A., Kapustin, M., & Ludwig, J. (2015). The impact of housing assistance on child outcomes: Evidence from a randomized housing lottery. The Quarterly Journal of Economics, 130(1), 465-506, which shows that the considerable boost to family economic resources from winning a Housing Choice Voucher was unrelated to subsequent test scores.
[14] National Academies of Sciences, Engineering, and Medicine. (2019). A roadmap to reducing child poverty. Washington, DC: National Academies Press, p. 89.
[15] Almond, D., Hoynes, H. W., & Schanzenbach, D. W. (2011). Inside the war on poverty: The impact of food stamps on birth outcomes. The Review of Economics and Statistics, 93(2), 387-403.
[16] Hoynes, H., Schanzenbach, D. W., & Almond, D. (2016). Long-run impacts of childhood access to the safety net. American Economic Review, 106(4), 903-34.
[17] Bailey, M. Hoynes, H., Rossin-Slater, M., & Walker R. (2020). Is the social safety net a long-term investment? Large-scale evidence from the food stamps program. NBER Working Paper 26942. Cambridge, MA: National Bureau of Economic Research.
[18] Baker, K. (2008). Do cash transfer programs improve infant health: Evidence from the 1993 expansion of the earned income tax credit. Unpublished manuscript, University of Notre Dame.
[19] Hoynes, H., Miller, D., & Simon, D. (2015). Income, the earned income tax credit, and infant health. American Economic Journal: Economic Policy, 7(1), 172-211.
[20] Dahl, G. B., & Lochner, L. (2012). The impact of family income on child achievement: Evidence from the earned income tax credit. American Economic Review, 102(5), 1927-56.
[21] Chetty, R., Friedman, J. N., & Rockoff, J. (2011). New evidence on the long-term impacts of tax credits. IRS Statistics of Income White Paper.
[22] Manoli, D., & Turner, N. (2018). Cash-on-hand and college enrollment: Evidence from population tax data and the earned income tax credit. American Economic Journal: Economic Policy, 10(2), 242-71.
[23] Bastian, J., & Michelmore, K. (2018). The long-term impact of the earned income tax credit on children’s education and employment outcomes. Journal of Labor Economics, 36(4), 1127-1163.
[24] Akee, R. K., Copeland, W. E., Keeler, G., Angold, A., & Costello, E. J. (2010). Parents' incomes and children's outcomes: a quasi-experiment using transfer payments from casino profits. American Economic Journal: Applied Economics, 2(1), 86-115.
[25] Costello, E. J., Erkanli, A., Copeland, W., & Angold, A. (2010). Association of family income supplements in adolescence with development of psychiatric and substance use disorders in adulthood among an American Indian population. JAMA, 303(19), 1954-1960.
[26] National Academies of Sciences, Engineering, and Medicine. (2019). A roadmap to reducing child poverty. Washington, DC: National Academies Press, Figure 4-9, p. 118. These estimates do not incorporate possible labor market responses to the benefit reductions.
[27] National Academies of Sciences, Engineering, and Medicine. (2019). A roadmap to reducing child poverty. Washington, DC: National Academies Press, Appendix F.
[28] The National Academies’ child allowance provided monthly payments totally $3,000 per year per child. The one-year child tax credit reforms in the American Rescue Plan Act of 2021 provide monthly payments for six months and then pays the remainder at tax time as part of the Child Tax Credit. Payments total $3,000 for each child age six and older and $3,600 for each child under the age of 6.